Elevation, latitude...
Here's a question that seems perfect for GIS - in fact, it's probably trivial for a skilled GIS person.
I have a farm in Hawaii, at approximately 20 degrees latitude, 750 meters elevation, and 3-4 meters of rainfall annually. Let's say I'd like to visit farmers elsewhere in the world - say, India or Central America - which have similar conditions. Where are they?
I'd guess this would involve making three areas, those with similar elevation, similar latitude, and similar rainfall, then finding their intersection.
The first decision, technically, would seem to be answering this question with rasters, or vectors. Both are technically possible, and I know that the elevation data is going to start as rasters, but I believe that GIS software more commonly does "intersection" with polygons, so I'll try that.
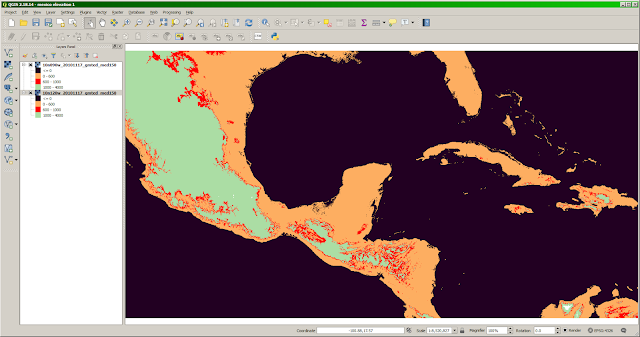
Well, that's a little surprising. Orange is too low, green is too high, so it seems like not much of Central America is within 800+/-200m elevation. Next step is to turn the areas we care about (in red) into polygons.
Attempt 1: Raster: Conversion: Polygonize (Raster to Vector). This opens a dialog to call gdal_polygonize for you. There doesn't seem to be a way to limit it to a range of values (just the red areas), but maybe I can filter that out later? Pressing the "Filter" checkbox gives an error, minor bug #1:
Attempt 2: Raster: Extraction: Contour. Maybe I can get the contours of my desired elevation range as polygonal areas? I enter 200 as the "Interval between contour lines" and give "200m.shp" as the "Output file". But, it gives an error that "ERROR 1: contours_200m.shp is not a directory." Apparently the "output file" isn't a file (minor bug #2) so I give it a directory name instead, and it works. I do the same for my other raster by selecting the layer and giving the command 'Raster: Extraction: Contour', but ... (minor bug #3) it still defaults to using my other raster layer, not the selected layer. Eventually, I get my output contours:
 That's nice but... they are polylines (LineString), not polygons, so that's not going to work for area operations.
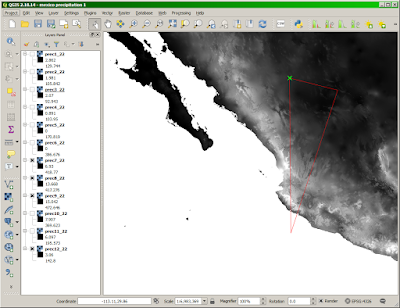
Attempt 3...: I looked at the "Raster Calculator", but that doesn't seem to be able to filter. I looked at "Raster: Extraction: Clipper", "Raster: Analysis: DEM", etc. Nothing seems to do the simple operation that would give me my red areas as polygons. Googling for a recipe turns up Convert raster to smooth contour polygons in QGIS which recommends using GRASS (Processing Toolbox>Grass>Raster>r.recode). I've always thought GRASS was a powerful-but-weird software that was best avoided, but I'll give it a try. It remaps a range of values, so I give it a range like this, hoping to get "1" in my range and no data outside it, and also use this opportunity to limit the latitude from 15 to 25 degrees:

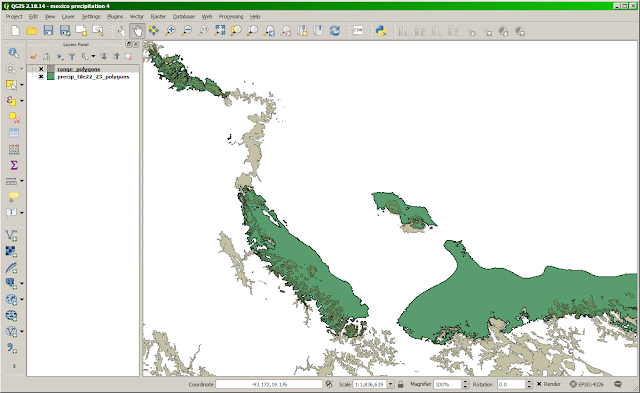
The next step is to turn those purple raster areas into polygons, again with gdal_polygonize., then Vector: Geoprocessing: Union to join the two SHP into a single SHP. Here is the desired area as red polygons:

That's pretty good! Next steps will be to limit (intersection) by rainfall, then overlay the result on OpenStreetMap.
I have a farm in Hawaii, at approximately 20 degrees latitude, 750 meters elevation, and 3-4 meters of rainfall annually. Let's say I'd like to visit farmers elsewhere in the world - say, India or Central America - which have similar conditions. Where are they?
I'd guess this would involve making three areas, those with similar elevation, similar latitude, and similar rainfall, then finding their intersection.
The first decision, technically, would seem to be answering this question with rasters, or vectors. Both are technically possible, and I know that the elevation data is going to start as rasters, but I believe that GIS software more commonly does "intersection" with polygons, so I'll try that.
Part 1: Elevation
I grabbed some common free data (GMTED2010) from the USGS, loaded into QGIS, and used Layers: Properties: Band Rendering to show the elevation range of 600-1000 meters in red. This is two raster with the same style:
Well, that's a little surprising. Orange is too low, green is too high, so it seems like not much of Central America is within 800+/-200m elevation. Next step is to turn the areas we care about (in red) into polygons.
Attempt 1: Raster: Conversion: Polygonize (Raster to Vector). This opens a dialog to call gdal_polygonize for you. There doesn't seem to be a way to limit it to a range of values (just the red areas), but maybe I can filter that out later? Pressing the "Filter" checkbox gives an error, minor bug #1:
(Traceback (most recent call last): File "/QGIS2~1.18/apps/qgis/./python/plugins\GdalTools\tools\doPolygonize.py", line 85, in fillMaskFileEdit if not maskFile(): TypeError: 'unicode' object is not callable)So, I ignore Filter, specify a Shapefile and press OK. It grinds away for a minute, then produces a huge set of polygons where every single pixel of the input raster has become its own tiny polygon. That doesn't seem right.
Attempt 2: Raster: Extraction: Contour. Maybe I can get the contours of my desired elevation range as polygonal areas? I enter 200 as the "Interval between contour lines" and give "200m.shp" as the "Output file". But, it gives an error that "ERROR 1: contours_200m.shp is not a directory." Apparently the "output file" isn't a file (minor bug #2) so I give it a directory name instead, and it works. I do the same for my other raster by selecting the layer and giving the command 'Raster: Extraction: Contour', but ... (minor bug #3) it still defaults to using my other raster layer, not the selected layer. Eventually, I get my output contours:

Attempt 3...: I looked at the "Raster Calculator", but that doesn't seem to be able to filter. I looked at "Raster: Extraction: Clipper", "Raster: Analysis: DEM", etc. Nothing seems to do the simple operation that would give me my red areas as polygons. Googling for a recipe turns up Convert raster to smooth contour polygons in QGIS which recommends using GRASS (Processing Toolbox>Grass>Raster>r.recode). I've always thought GRASS was a powerful-but-weird software that was best avoided, but I'll give it a try. It remaps a range of values, so I give it a range like this, hoping to get "1" in my range and no data outside it, and also use this opportunity to limit the latitude from 15 to 25 degrees:
- recode rules: 600.0:1000.0:1:1
- region extent: -120,-60,15,25

The next step is to turn those purple raster areas into polygons, again with gdal_polygonize., then Vector: Geoprocessing: Union to join the two SHP into a single SHP. Here is the desired area as red polygons:

Comments
Post a Comment