Posts

Polygon layers with Mapbox Studio.. and exploring

Image
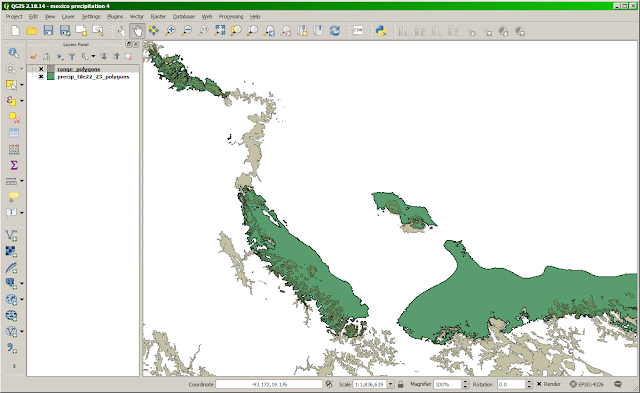
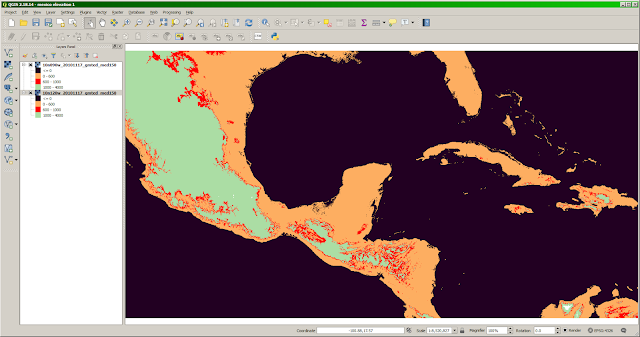
In the previous posts, we made two polygonal datasets for Central America: areas with an elevation range of 550-950 m areas with a precipitation range of 2600-4500 mm QGIS was buggy when I tried to compute the intersection of these areas, but in cases like this it's not really necessary to compute it, because it's not difficult to see visually, by setting the each layer to 50% transparency, as in the result of our last post: However, I'd like to be able to answer questions about these areas, like: Do people live there? How hard would it be to travel there?  For this, we need to superimpose this data on a basemap (preferably, a highly detailed basemap so we can zoom way in).  In the olden days, GIS packages had offline basemaps, and this can still be done by downloading and styling a dataset like  Natural Earth .  However, the far more flexible and modern way is to use a web map, which Mapbox Studio makes almost trivial: After logging into Mapbox Studio , I click

Adding rainfall

Image
In the previous post, we produced a polygonal area of Central America within a range of elevation and latitude. Now we want to limit to areas with roughly the same annual rainfall.  I've hunted around for a public global annual precipitation dataset. It's actually pretty hard to find.  Found: World Bank Average precipitation  is annual, but only per country. WorldClim - Global Climate Data , which is broken down by month, not annual. NASA NEO Rainfall TRMM  is also only available in monthly form. ArcGIS  Total Annual Precipitation  is annual, which is what we need, but unfortunately doesn't let you download it.  It's based on WorldClim. Well, that's frustrating. I also tried asking on Twitter  but the gistribe had no leads. Then, it occurred to me that I could try adding up all 12 months myself, using "raster arithmetic".  I did the following: From  WorldClim 1.4: Current conditions: download by tile , I clicked on tiles "22" and &q

Elevation, latitude...

Image
Here's a question that seems perfect for GIS - in fact, it's probably trivial for a skilled GIS person. I have a farm in Hawaii, at approximately 20 degrees latitude, 750 meters elevation, and 3-4 meters of rainfall annually.  Let's say I'd like to visit farmers elsewhere in the world - say, India or Central America - which have similar conditions.  Where are they? I'd guess this would involve making three areas, those with similar elevation, similar latitude, and similar rainfall, then finding their intersection. The first decision, technically, would seem to be answering this question with rasters, or vectors.  Both are technically possible, and I know that the elevation data is going to start as rasters, but I believe that GIS software more commonly does "intersection" with polygons, so I'll try that. Part 1: Elevation I grabbed some common free data ( GMTED2010 ) from the USGS, loaded into QGIS, and used Layers: Properties: Band Rendering

New blog for experiments

I've been a "geo person" since the 90s, but almost always as a tool maker , not as a tool user .  Despite years of writing and supporting 2D and 3D geovisualization software, I've never really used  regular GIS software. Sure, every few years I've fired up ESRI or FOSS GIS tools for a quick spin, but never used them to do real work - and as for the hipster neo-geo world where everything seems to be GeoJSON in The Cloud, I've barely ventured.  Hence, a blog to share some of my learning adventures.